"Is Rubber a Solid or a Liquid?"
"Rubber Shines as It Degrades."
Exploring the Frontlines of Degradation Mechanism Research
The degradation of materials and components can lead to various failures and accidents. Monitoring signs of degradation is therefore essential to prevent incidents and downtime. This is particularly challenging for rubber, since external appearance alone doesn't reveal internal degradation (stress relaxation), making it difficult to assess its condition. To address this, NOK is advancing research to evaluate stress relaxation by visualizing rubber's internal structure and chemical reactions. In this article, we will explain how the internal degradation occurring in rubber is visualized in practice.
Visualizing rubber's molecular structure using a method similar to medical MRI
Understanding the mechanisms of stress relaxation in rubber requires a multifaceted approach, from the macroscopic to the microscopic level. One method for analyzing rubber at the microscopic scale is through an instrument called NMR (nuclear magnetic resonance). This allows us to observe the state of cross-linking and molecular mobility within rubber.
The principle behind NMR is the same as that used in MRI (magnetic resonance imaging) in medical settings. When a sample is placed in a strong magnetic field, the nuclear spin of atoms aligns in the same direction. Applying pulsed magnetic waves excites the nuclei, and the time it takes for the nuclear spin to return to a stable state is measured.
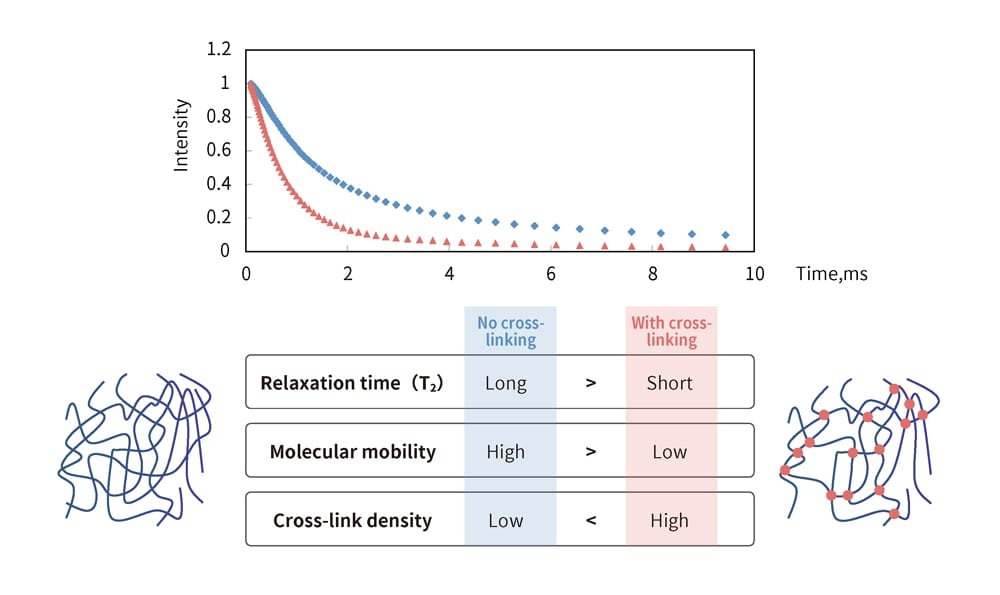
The faster molecules collide with each other, the quicker they lose energy and return to a stable state. Figure 1 shows the transition of energy intensity. The red curve represents cases in which the energy stabilizes quickly, while the blue curve shows slower stabilization, indicating fewer molecular collisions and a longer time to return to a stable state.
When applied to rubber's internal structure, the more cross-linking points there are, the more restricted molecular motion becomes, making movement difficult. Conversely, when there are fewer cross-linking points, the material approaches a liquid-like state, allowing molecules to move more freely. For rubber with many cross-linking points and stronger stress, the NMR measurements reveal a steeper decline in intensity, resembling the red curve in the graph, indicating stabilization in a shorter time.
Please enlarge the screen to view
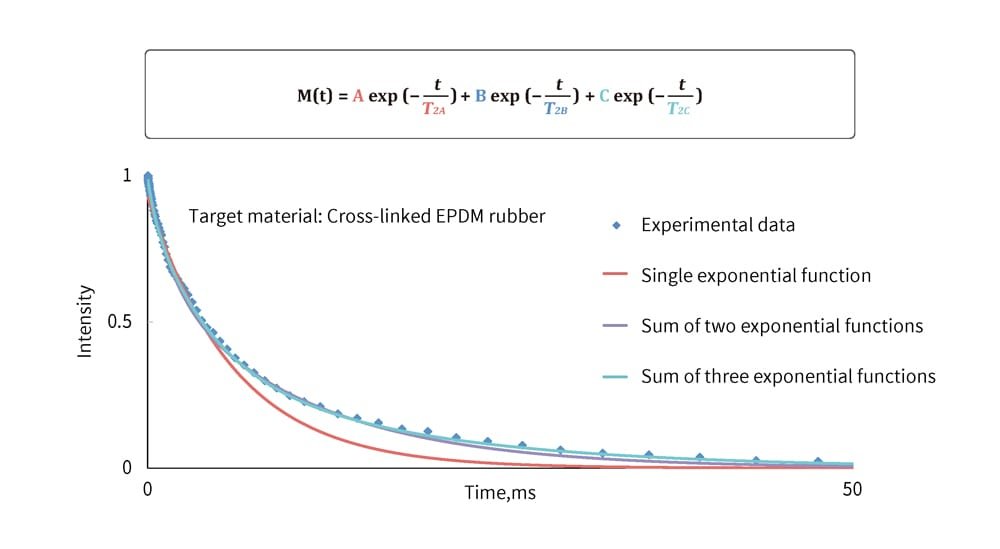
In traditional research, NMR measurement results were represented using approximation formulas combining several exponential or Gaussian functions (function fitting) and then linked to the rubber structure. However, this approach varied depending on how researchers combined the functions, making standardized evaluations challenging (Figure 2). To address this, the curves in these graphs were analyzed using an inverse Laplace transform (Figure 3).
Please enlarge the screen to view
Please enlarge the screen to view
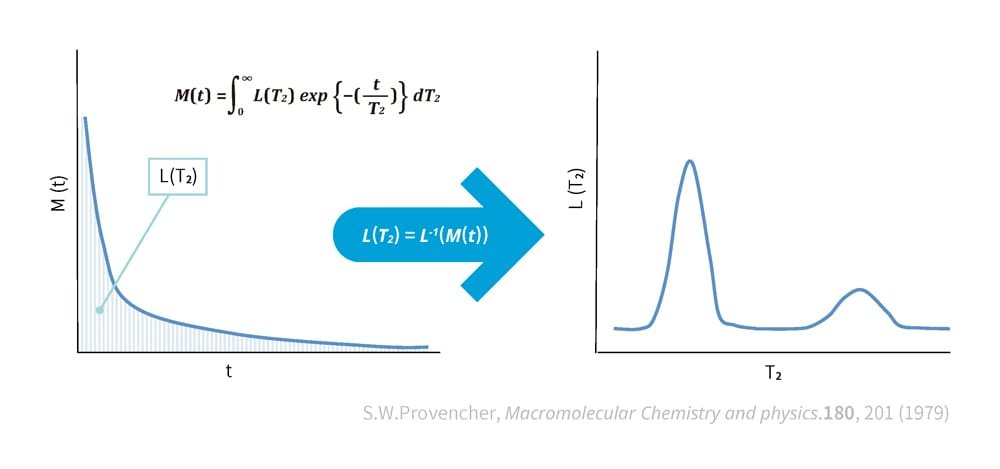
This method involves performing an inverse Laplace transform on NMR measurement data to conduct a spectral analysis. Spectral analysis is the process of analyzing and extracting individual components from information composed of multiple mixed components. When NMR measurement results are processed through the inverse Laplace transform, distinct peaks emerge for the main components. These peaks are prominently visible in the graph on the right side of Figure 3.
Using this method, differences in the rate of intensity decline in the measurement results can be identified by examining the positions of the peaks in the spectrum. The large peak on the left side represents cross-links or the entanglement of polymer chains, indicating a state similar to a constrained solid (with a steep decline in intensity). As the peaks shift further to the right, they indicate a state closer to a freely moving liquid.
Now let's look at an example in which rubber was deliberately degraded and then analyzed. The rubber was subjected to degradation in air at a temperature of 150°C. Oxygen in the air caused the polymer chains within the rubber to break. The degradation over time was measured and analyzed. The results are shown in Figure 4. The black line represents the state before degradation, the blue line shows degradation after 2 hours, red after 3 hours, purple after 12 hours, and yellow after 24 hours.
This demonstrates that as the exposure time at a high temperature increases, the highest peak becomes smaller and shifts to the right. A shift to the right indicates a state closer to a liquid — meaning that more polymer chains are being broken, and degradation is ocurring.
Please enlarge the screen to view
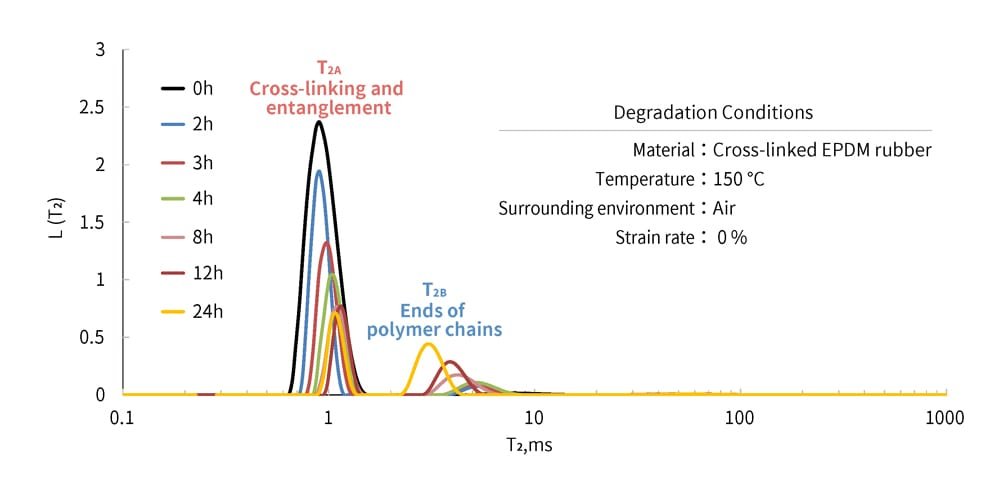
An intriguing phenomenon can be observed here. The second peak, located further to the right, gradually shifts to the left and grows larger, contrary to the highest peak. A shift to the left indicates that the molecules are becoming less mobile. In other words, the polymer chains break and create two ends, increasing their quantity, and they also become shorter, which reduces their mobility (Figure 5). This analysis reveals that degradation significantly alters the internal structure of rubber, a finding made possible through the inverse Laplace transform analysis.
Please enlarge the screen to view

Analyzing chemical reactions by leveraging the phenomenon of rubber "glowing" during degradation
In addition to the molecular structure analysis discussed so far, NOK is advancing research focused on analyzing chemical reactions. This approach captures degradation caused by changes in the cross-linked structure of rubber and also helps verify the effectiveness of anti-degradation measures. When combined with molecular structure analysis, it provides a deeper understanding of the degradation process.
One type of chemical analysis method is the in-situ observation of the oxidative decomposition of polymers. Interestingly, when rubber degrades, it emits a faint glow that is invisible to the human eye. This phenomenon is applied using an analytical method.
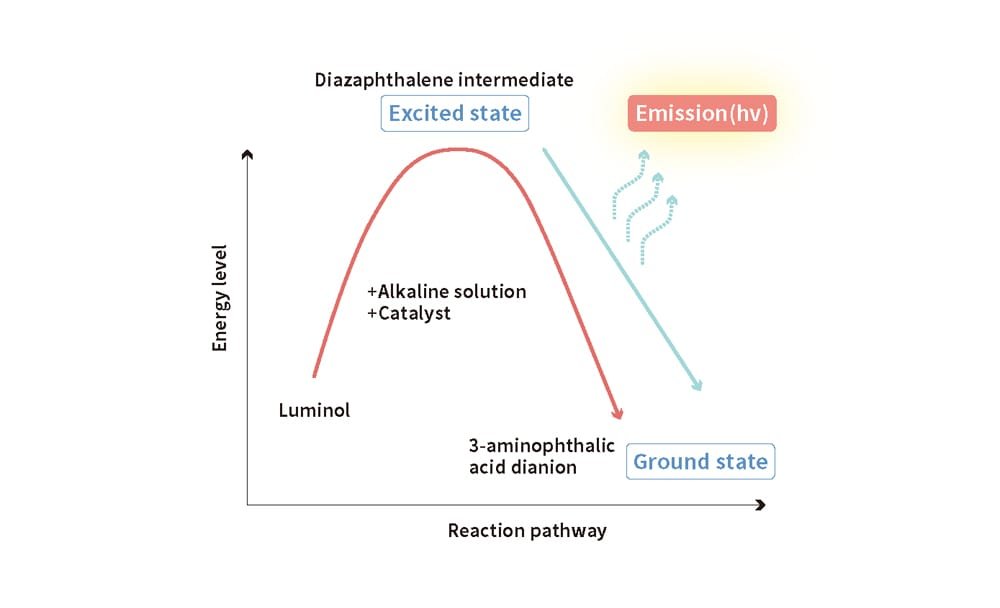
Oxidative decomposition can be analyzed using chemiluminescence, a chemical light emission process (Figure 6). Chemiluminescence refers to the emission of light without the use of electricity. For example, glow sticks used by fans during live performances at pop concerts emit light through this chemical reaction.
Bending a glow stick triggers a chemical reaction involving luminol. During this reaction, luminol transforms into another substance, releasing light as it stabilizes its energy state. Similarly, chemiluminescence occurs when energy from a chemical reaction is emitted as light. Observing the emitted light makes it possible to measure the extent of the chemical reaction.
Please enlarge the screen to view
From a chemical perspective, rubber undergoes a phenomenon called auto-oxidation, in which polymers degrade due to the influence of heat energy and oxygen in the air. Typically, atoms and molecules pair electrons in twos, creating a stable state. When rubber is exposed to heat and reacts with oxygen, the electrons become excited, move, and generate unpaired electrons known as peroxide radicals. These radicals are highly unstable and produce excited-state carbonyls as they stabilize, releasing energy in the process. This energy release also produces chemiluminescence, which can be observed as a way to track the degradation reactions of rubber.
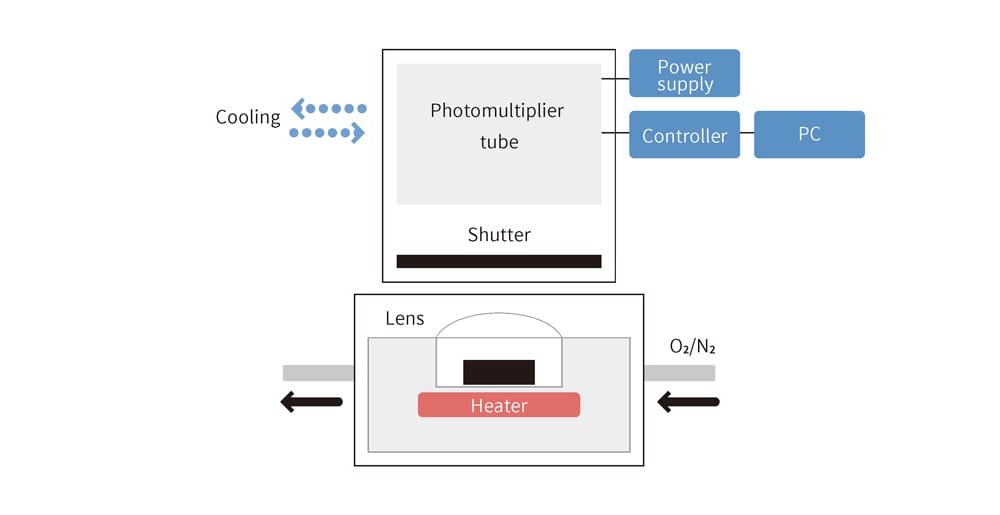
The light emitted is extremely faint and cannot be seen with the naked eye, unlike glow sticks. To address this, a special device called a chemiluminescence analyzer, which uses a photomultiplier tube, is used to detect these faint light emissions while applying heat to the target being analyzed (Figure 7). To better simulate the conditions in which rubber is used, NOK developed specialized fixtures to maintain the rubber in a deformed state during observation.
Please enlarge the screen to view
Tracking chemiluminescence makes it possible to quantitatively investigate how susceptible the target rubber is to oxidative degradation. This observation employs a device called a chemiluminescence analyzer. Since the intensity of chemiluminescence increases as the chemical reaction begins, the time it takes for this increase to occur is used to evaluate the susceptibility. In other words, the chemical reaction of polymer degradation due to oxidation can be visualized (Figure 8). The time until the increase in light intensity begins depends on how easily oxidation occurs. The shorter this time, the more susceptible the material is to degradation by oxygen, while a longer time indicates higher durability.
Please enlarge the screen to view
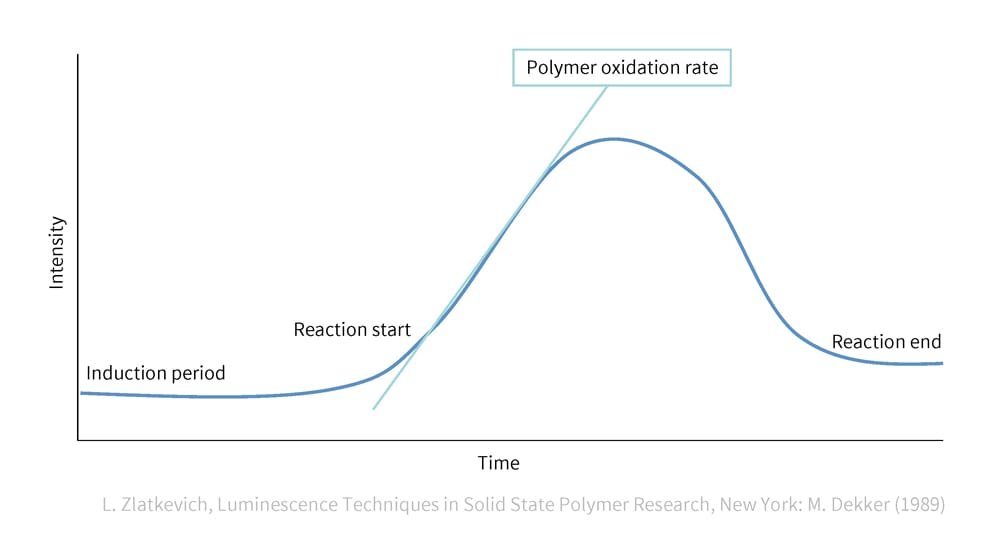
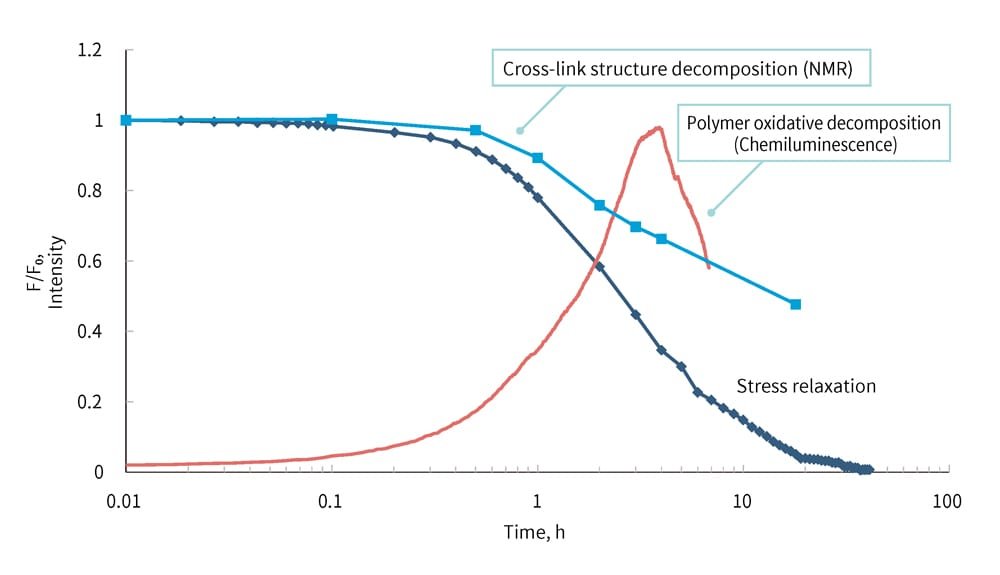
Figure 9 overlays the stress relaxation and chemiluminescence graph indicating polymer oxidation and decomposition with the graph of cross-link structure breakdown observed through NMR. This graph clearly shows where the changes in the cross-link structure or polymer decomposition begin. In this example, it is evident that the significant decrease in stress relaxation is largely influenced by changes in the cross-link structure caused by the oxidative decomposition of polymer chains.
Please enlarge the screen to view
Applications of chemiluminescence observation beyond rubber degradation
The chemiluminescence analytical method can also be applied to materials other than rubber, such as resins. An example involving resins is the formation of electronic circuits on thin and durable substrates, products known as FPC (flexible printed circuits) (Figure 10). Recently, Mektec (name changed from Nippon Mektron in July 2024) has received increasing requests from customers for products that can withstand temperatures of around 200-250°C to make it possible to use them in power semiconductors installed in EVs (electric vehicles) and other applications.
Please enlarge the screen to view
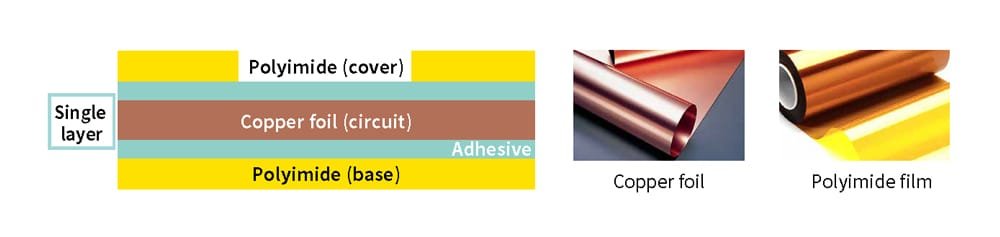
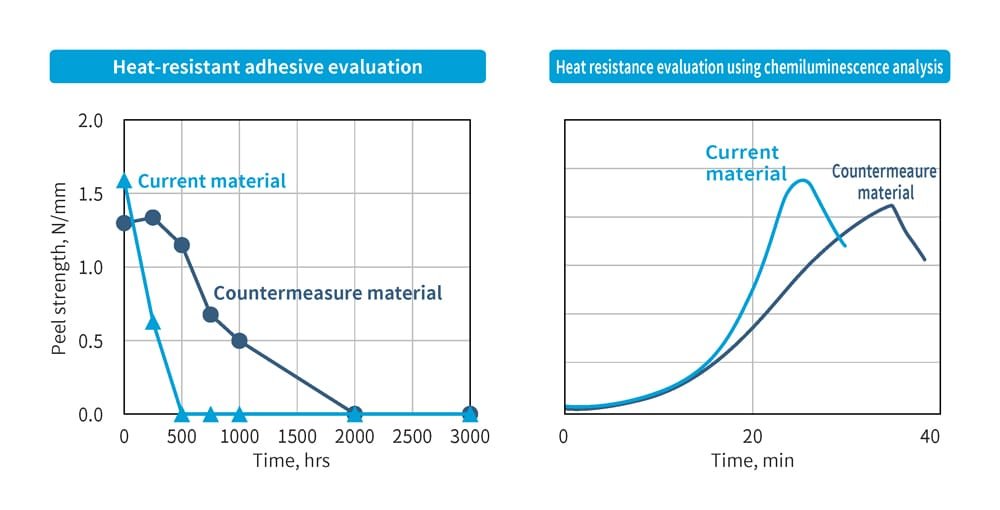
The base material for FPC consists of copper foil bonded to one or both sides of polyimide using a resin-based adhesive. This adhesive is tested and evaluated beforehand to determine its ability to withstand high temperatures. During automotive heat resistance evaluations, FPC is continuously heated for approximately 3,000 hours to ensure that the peel strength (the strength required to peel the adhesive under external force) does not fall below the standard value. The left graph in Figure 11 shows an example of such evaluation results. When no countermeasures are applied, the strength decreases rapidly, reaching zero within 500 hours. In contrast, materials with anti-oxidation measures maintain their strength for up to 2,000 hours.
The results of evaluating resin-based adhesive degradation using chemiluminescence analysis are shown in the right graph of Figure 11. Light emission peaks after 20 minutes for materials without countermeasures, while for materials with countermeasures, the peak occurs after 30 minutes. This demonstrates how the effectiveness of the countermeasures can be verified.
Please enlarge the screen to view
The degradation state of a material cannot be fully understood through surface observation alone. Similarly, its resistance to heat, external forces and chemical substances cannot always be thoroughly examined over long periods in real-world environments. For this reason, it is essential to understand, grasp and observe the material's internal structure and investigate the mechanisms of degradation. The technical ability to develop methods for such investigations is as important as design and manufacturing is in ensuring the reliability of products and manufacturing processes.